See the business as one operating system
Bring commercial, customer, service and operational performance into one analytical layer instead of reconciling separate departmental dashboards.
Bring sales, marketing, support, projects, loyalty, billing, inventory and field operations into one decision layer, then move from high-level performance to the records, segments and actions behind it.
Built for leadership teams and functional owners who need one view of performance across revenue, customers and operations without rebuilding the story across separate spreadsheets and reporting tools.
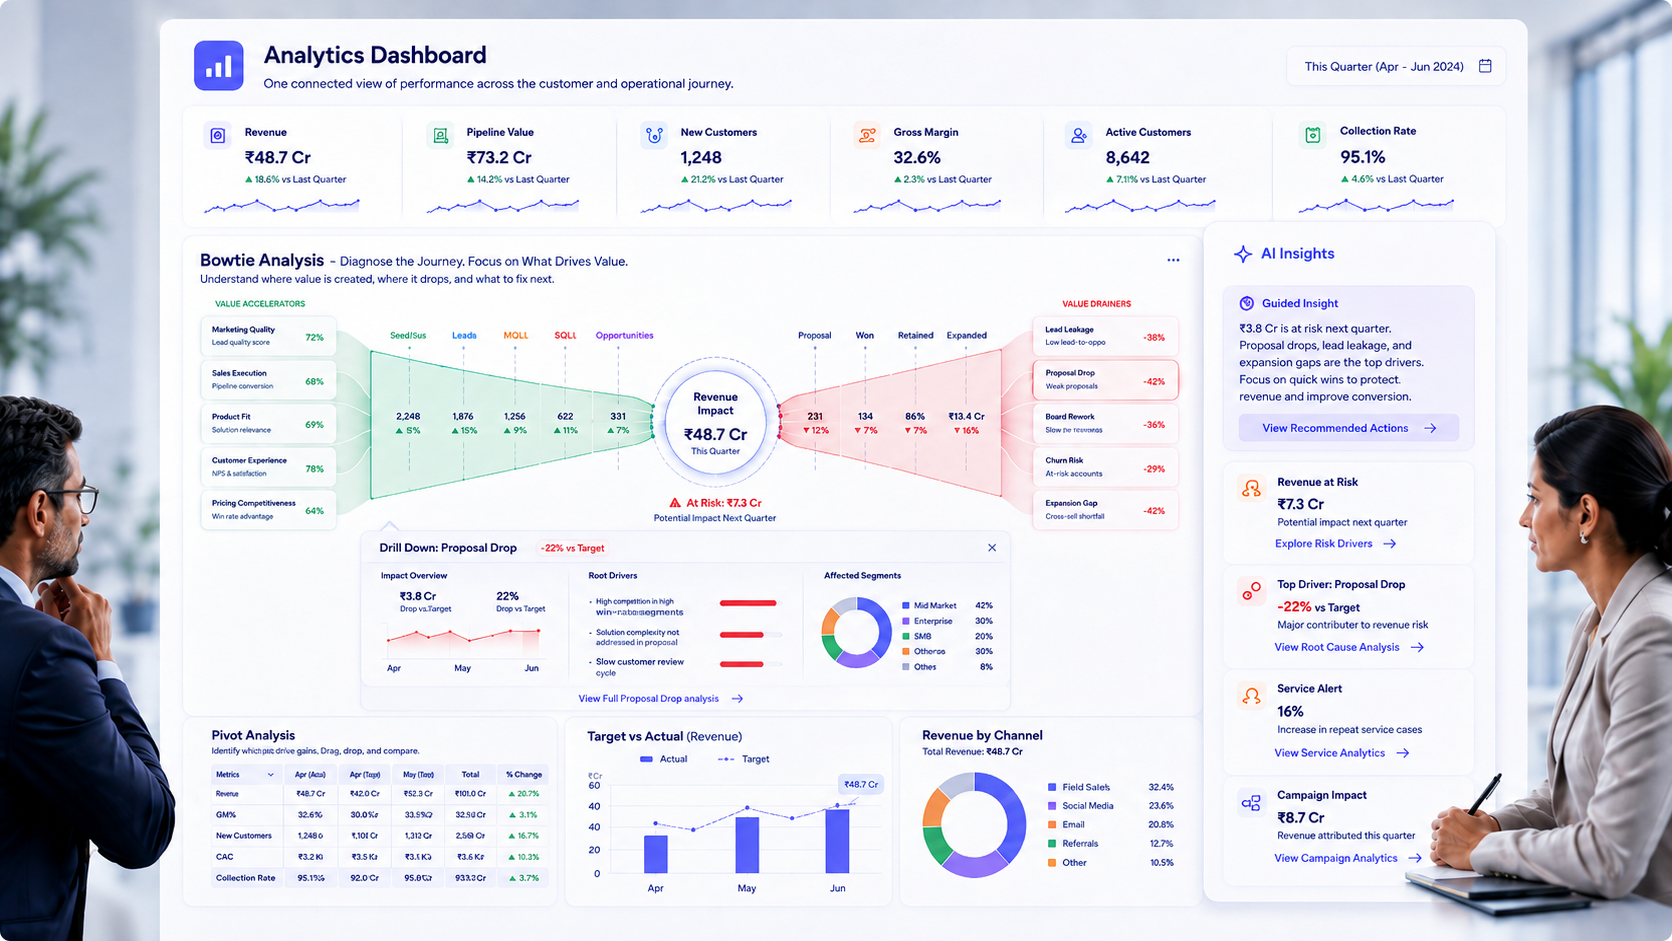
The number itself is only the beginning. automateCRM connects dashboards, pivots, comparisons and conversational analysis to the same operational records so teams can move from what happened, to why it happened, to what needs attention next.
Bring commercial, customer, service and operational performance into one analytical layer instead of reconciling separate departmental dashboards.
Start with a KPI, chart or pivot result and drill into the records behind it when managers need to understand what is driving the number.
Use targets, actuals, trends, periods, regions, products and teams to understand whether performance is improving and where intervention may be required.
Use conversational analytics to explore business questions without building another dashboard every time leadership wants to investigate a different angle.
From executive KPIs to detailed pivots and conversational analysis, automateCRM turns connected customer and operational data into a decision layer that different teams can explore from their own perspective.
Give leaders and functional teams the right view without creating different versions of the truth.
Leadership and functional teams need different perspectives on performance. Build dashboards around their decisions while keeping sales, marketing, service, projects and operations connected to the same underlying data.
Explore large datasets from different angles without rebuilding reports every time.
Use interactive pivot analysis to group, compare and summarize operational data across dimensions and measures, then drill into the records behind the result when deeper investigation is required.
Ask business questions in natural language and investigate the answer further.
When an existing report does not answer the next management question, use conversational analytics to explore performance, compare drivers and ask follow-up questions using the same connected business data.
Diagnose where value is created, where it leaks and what deserves attention next.
Bowtie Analysis connects the path into conversion with what happens after it, helping teams see where value is being created, where customers or revenue are dropping out and which drivers deserve deeper investigation.
Connect pipeline movement, conversion and actual revenue in one analytical view.
Analyse opportunity movement, conversion, targets and revenue together so managers can understand whether current sales execution is sufficient to deliver expected business outcomes.
Connect campaign investment to qualified demand and downstream business outcomes.
Connect campaign, channel and source performance with qualification and downstream conversion so marketing decisions are based on more than delivery, opens and clicks.
See where support quality is improving, slipping or repeatedly creating customer risk.
Analyse backlog, SLA performance, recurring issues and customer service outcomes so support leaders know where operational attention is required.
Turn project schedules and execution history into visibility on delivery health.
Analyse project progress, milestone performance, overdue work and delivery risk across active customer and operational projects.
Understand customer value, engagement and retention beyond the first transaction.
Use customer history, engagement and purchase patterns to understand retention, repeat behaviour and segments that may require different growth or reactivation strategies.
Bring customer demand and operational readiness into the same analytical conversation.
Bring inventory, fulfilment and other operational signals into analytics so teams can understand where execution constraints may be affecting customer or revenue outcomes.
See how territories, routes and field execution perform across geography.
Analyse sales, visits, coverage and operational activity geographically so managers can understand where territories are performing differently and where field execution needs attention.
Shape reporting around the decisions your business actually needs to make.
Configure reports, filters, analytical views and exports around your own modules, processes and operating model while keeping the analytics directly connected to automateCRM data.
A dashboard can tell you that something changed. The real value comes from understanding why, finding the records behind it and acting while the signal is still relevant.
Because automateCRM Analytics sits on the same customer and operational platform, teams can move from performance to context without rebuilding the analysis in another system.
automateCRM does not force every job through the same generic CRM interface. Processes can open the record, guided form or purpose-built business screen needed for that step, with the relevant customer and process context already in place.
The impact goes beyond cleaner dashboards. Teams spend less time reconciling reports, managers identify issues earlier and decisions become easier to connect to the operational reality behind the numbers.
Commercial, customer and operational metrics come from the same system context instead of being rebuilt independently by every function.
Conversion drops, SLA problems, delivery delays and operational underperformance become easier to identify when the relevant signals are visible together.
Pivots, drill-down and flexible analysis help teams move beyond a headline KPI and inspect the records and dimensions driving it.
Teams spend less time exporting, combining and reformatting spreadsheets simply to recreate recurring management views.
Sales, marketing, service, projects and operations retain their own perspectives without creating different versions of business reality.
Because analytics remains connected to operational records, managers can move from a signal toward the customers, opportunities, cases or projects that need attention.
See how automateCRM can bring dashboards, pivots, conversational analytics, attribution, service, project, loyalty and operational reporting together in one connected analytics layer.
Bring leadership, department heads and execution teams into the same analytical environment without making per-user pricing a barrier.
Move from an analytical signal to the customers, opportunities, cases, projects and operational records behind it without rebuilding context elsewhere.
A few quick answers about dashboards, pivots, conversational analytics, cross-functional reporting and exports.
Yes. Different teams can focus on the KPIs relevant to their role while the dashboards continue to reference the same underlying automateCRM data.
Yes. Pivot analysis can be used to group, compare and summarize larger datasets across multiple dimensions and measures, with drill-down into underlying records where required.
Yes. Conversational analytics can help users explore business questions and follow-up questions without requiring a new dashboard for every analytical scenario.
Yes. Campaign, source and channel information can be analyzed alongside qualification, pipeline and revenue context where that data is available inside automateCRM.
Yes. The analytics layer can include service, SLA, project, delivery and other operational signals in addition to commercial reporting.
Yes. Customer engagement, repeat behaviour, loyalty activity and segmentation such as RFM can be analysed where the relevant data is available.
Yes. Detailed data and reporting views can be exported when teams require offline sharing or further analysis, while interactive analytics remains available inside automateCRM.
Yes. As automateCRM is configured with custom fields, modules and processes, reporting can be structured around the data and operating model relevant to the business.
Bring us your most pressing operational challenge. We'll explore how the right workflows, interfaces, integrations, automation and agentic AI can come together around it.